


COMPETITIVE ANALYSIS AND SIMULATIONS
Competitive Analysis Simulation
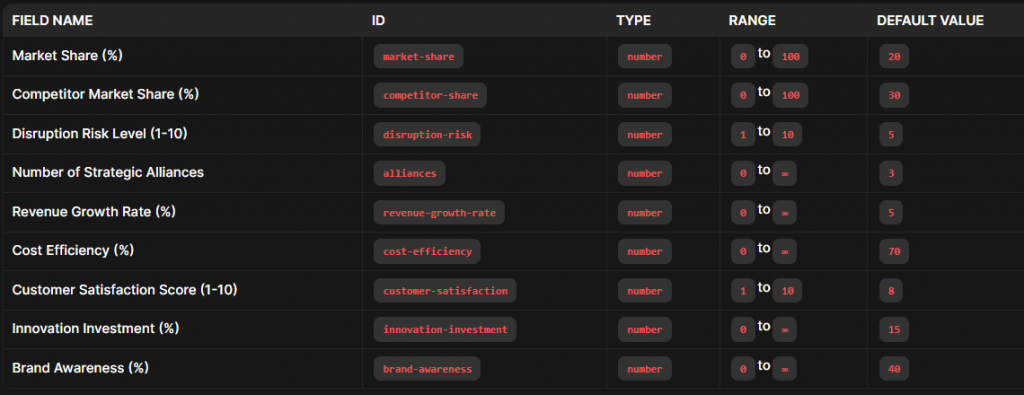
The Competitive Analysis Simulation helps you assess your company’s competitive position by evaluating various key metrics. This simulation takes into account the following factors:
- Market Share (%) : The percentage of the market controlled by your company. Higher market share indicates stronger market presence and potentially higher revenue.
- Competitor Market Share (%) : The percentage of the market controlled by your main competitors. Lower competitor share indicates less competition and potentially easier market penetration.
- Disruption Risk Level (1-10) : A risk level indicator for potential disruptions in the market. Lower disruption risk indicates a more stable market environment.
- Number of Strategic Alliances : The number of strategic partnerships your company has. More alliances can provide additional resources and market reach.
- Revenue Growth Rate (%) : The year-over-year growth rate of your company’s revenue. Higher growth rates indicate financial health and market success.
- Cost Efficiency (%) : The efficiency of your company’s cost structure. Higher cost efficiency indicates better resource management and profitability.
- Customer Satisfaction Score (1-10) : A customer satisfaction rating. Higher scores indicate better customer satisfaction and loyalty.
- Innovation Investment (%) : The percentage of your budget invested in innovation. Higher investment in innovation can drive product development and competitive advantage.
- Brand Awareness (%) : The level of brand awareness among your target audience. Higher brand awareness indicates greater recognition and trust.
By inputting values for these fields, the simulation will provide a comprehensive analysis and an overall score to help you understand your competitive strengths and areas for improvement.
CUSTOMER EXPERIENCE ANALYSIS AND SIMULATIONS
Customer Experience Analysis and Simulations
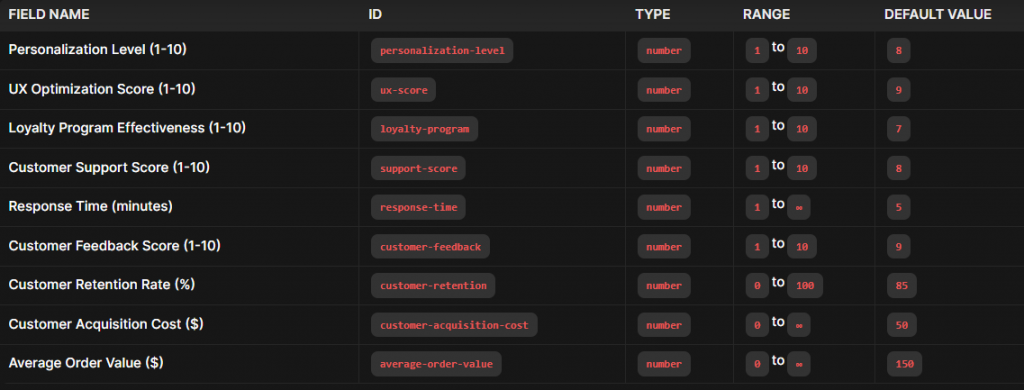
The Customer Experience Analysis and Simulations tool helps you evaluate and enhance your customer experience by assessing various key metrics. This simulation takes into account the following factors:
- Personalization Level (1-10) : Measures how well your company personalizes its offerings to meet customer needs. Higher scores indicate better personalization.
- UX Optimization Score (1-10) : Evaluates the effectiveness of user experience optimizations. Higher scores indicate a more user-friendly and engaging experience.
- Loyalty Program Effectiveness (1-10) : Assesses the impact of your loyalty programs on customer retention and satisfaction. Higher scores indicate more effective loyalty programs.
- Customer Support Score (1-10) : Evaluates the quality and effectiveness of your customer support services. Higher scores indicate better customer support.
- Response Time (minutes) : Measures the speed of response to customer inquiries and issues. Lower response times indicate faster and more responsive service.
- Customer Feedback Score (1-10) : Captures customer feedback ratings and satisfaction levels. Higher scores indicate more positive feedback.
- Customer Retention Rate (%) : Indicates the percentage of customers who continue to do business with your company. Higher retention rates are crucial for long-term success.
- Customer Acquisition Cost ($) : Represents the cost of acquiring a new customer. Lower acquisition costs indicate more efficient customer acquisition.
- Average Order Value ($) : Represents the average value of each customer order. Higher average order values indicate more revenue per customer.
By inputting values for these fields, the simulation will provide a comprehensive analysis and an overall score to help you understand your current customer experience and identify areas for improvement.
CUSTOMER LIFE CYCLE
Customer Lifecycle Simulation
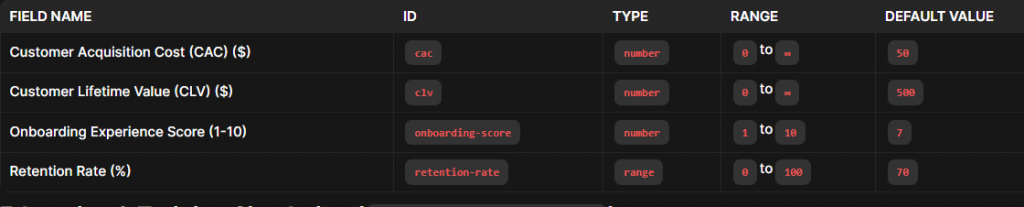
The Customer Lifecycle Simulation helps you assess and optimize the various stages of your customer journey from acquisition to retention. This simulation takes into account the following factors:
- Customer Acquisition Cost (CAC) ($) : Represents the cost of acquiring a new customer. Lower CAC indicates more efficient customer acquisition.
- Customer Lifetime Value (CLV) ($) : Represents the total value a customer brings to your company over their lifetime. Higher CLV indicates more valuable customers.
- Onboarding Experience Score (1-10) : Measures the quality of the onboarding experience, which impacts customer satisfaction and retention. Higher scores indicate a better onboarding process.
- Retention Rate (%) : Indicates the percentage of customers who continue to do business with your company over time. Higher retention rates are crucial for long-term success.
- Churn Rate (%) : Represents the percentage of customers who stop doing business with your company. Lower churn rates indicate better customer retention.
- Customer Engagement Score (1-10) : Measures the level of engagement with your customers throughout their lifecycle. Higher scores indicate more engaged customers.
- Customer Satisfaction Score (1-10) : Captures customer satisfaction ratings and feedback. Higher scores indicate higher customer satisfaction.
- Upsell/Cross-Sell Opportunities (1-10) : Evaluates the effectiveness of upselling and cross-selling strategies. Higher scores indicate more successful upsell/cross-sell efforts.
- Customer Support Score (1-10) : Assesses the quality and effectiveness of customer support services. Higher scores indicate better customer support.
By inputting values for these fields, the simulation will provide a comprehensive analysis and an overall score to help you understand your customer lifecycle performance and identify areas for improvement.
EDUCATION AND TRAINING
Education and Training Simulation
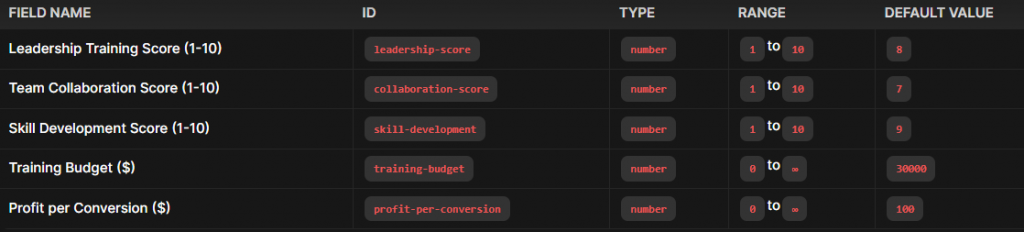
The Education and Training Simulation helps you evaluate and enhance your company’s education and training programs to improve employee performance and organizational efficiency. This simulation takes into account the following factors:
- Leadership Training Score (1-10) : Measures the effectiveness of leadership training programs. Higher scores indicate better leadership training.
- Team Collaboration Score (1-10) : Evaluates the level of collaboration within your team. Higher scores indicate better teamwork and collaboration.
- Skill Development Score (1-10) : Assesses the effectiveness of skill development initiatives. Higher scores indicate more effective skill development.
- Training Budget ($) : Represents the amount allocated to training programs. A balanced budget ensures adequate funding for training efforts.
- Employee Satisfaction Score (1-10) : Captures the satisfaction levels of employees with the training programs. Higher scores indicate higher employee satisfaction.
- Knowledge Retention Rate (%) : Indicates the percentage of knowledge retained by employees after training sessions. Higher retention rates ensure better long-term training effectiveness.
- Training Program Diversity (1-10) : Measures the variety and diversity of training programs offered. Higher scores indicate a broader range of training opportunities.
- Training Completion Rate (%) : Represents the percentage of employees who complete their assigned training programs. Higher completion rates indicate better adherence to training schedules.
- Performance Improvement Score (1-10) : Evaluates the improvement in employee performance post-training. Higher scores indicate more significant performance gains.
By inputting values for these fields, the simulation will provide a comprehensive analysis and an overall score to help you understand the effectiveness of your education and training programs and identify areas for improvement.
FINANCIAL PLANNING
Financial Planning Simulation
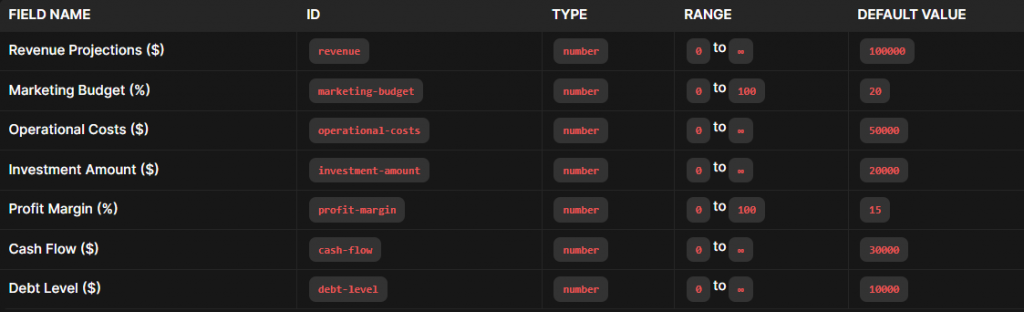
The Financial Planning Simulation helps you assess and optimize your company’s financial strategies to ensure long-term stability and growth. This simulation takes into account the following factors:
- Revenue Projections ($) : Represents the projected revenue for your company. Higher projections indicate stronger financial performance.
- Marketing Budget (%) : Indicates the percentage of revenue allocated to marketing. A balanced budget ensures effective marketing without overspending.
- Operational Costs ($) : Represents the costs associated with running day-to-day operations. Lower costs indicate better cost efficiency.
- Investment Amount ($) : Indicates the amount allocated to investments. Higher investment can drive future growth but requires careful financial management.
- Profit Margin (%) : Represents the percentage of revenue left after deducting costs. Higher profit margins indicate better profitability.
- Cash Flow ($) : Indicates the net cash generated or used by your company. Positive cash flow is essential for sustaining operations and investing in growth.
- Debt Level ($) : Represents the total debt your company has. Lower debt levels indicate better financial health and reduced financial risk.
- Net Income ($) : Represents the net income of your company after all expenses and taxes. Higher net income indicates better financial performance.
- Return on Investment (ROI) (%) : Measures the return on your investment. Higher ROI indicates more profitable investments.
- Financial Risk Score (1-10) : Evaluates the overall financial risk associated with your current strategies. Lower scores indicate lower financial risk.
By inputting values for these fields, the simulation will provide a comprehensive analysis and an overall score to help you understand your financial planning performance and identify areas for improvement.
MARKETING AND SALES
Marketing and Sales Simulation
The Marketing and Sales Simulation helps you assess and optimize your company’s marketing and sales strategies to improve customer acquisition and conversion. This simulation takes into account the following factors:
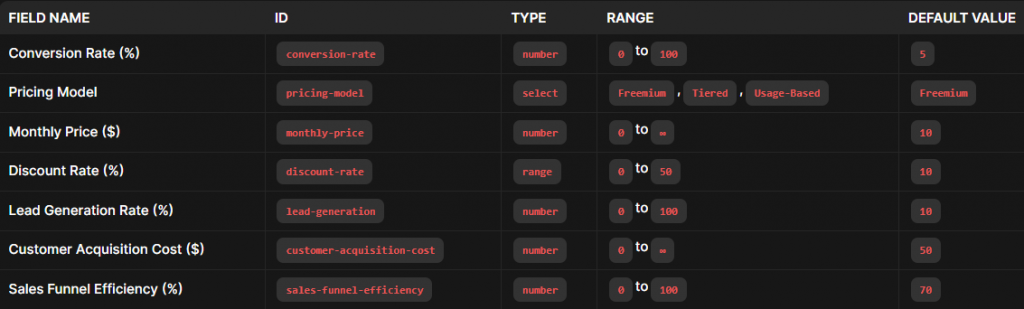
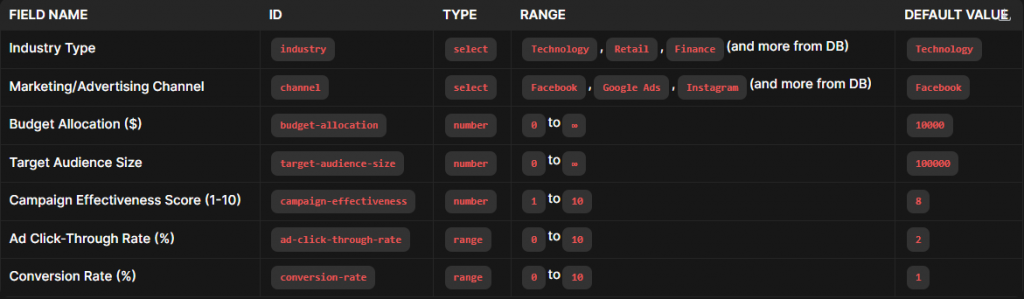
- Conversion Rate (%) : Represents the percentage of visitors who convert into customers. Higher conversion rates indicate more effective sales strategies.
- Pricing Model : Indicates the type of pricing model used for your product (e.g., Freemium, Tiered, Usage-Based). Different models can impact customer acquisition and retention.
- Monthly Price ($) : Represents the monthly subscription price for your product. Competitive pricing is crucial for attracting and retaining customers.
- Discount Rate (%) : Indicates the percentage discount offered to customers. Higher discount rates can increase customer acquisition but may affect profitability.
- Lead Generation Rate (%) : Represents the percentage of interactions that result in lead generation. Higher lead generation rates indicate more potential customers.
- Customer Acquisition Cost ($) : Indicates the cost of acquiring a new customer. Lower acquisition costs indicate more efficient marketing efforts.
- Sales Funnel Efficiency (%) : Measures the efficiency of your sales funnel in converting leads into paying customers. Higher efficiency indicates better sales processes.
- Ad Click-Through Rate (%) : Indicates the percentage of ads clicked by the target audience. Higher click-through rates indicate more effective advertising.
- Email Open Rate (%) : Indicates the percentage of emails opened by recipients. Higher open rates indicate better email marketing effectiveness.
- Website Traffic (visits/day) : Represents the daily number of visitors to your website. Higher traffic can lead to more potential customers.
- Customer Feedback Score (1-10) : Captures customer feedback ratings and satisfaction levels. Higher scores indicate more positive feedback and customer satisfaction.
By inputting values for these fields, the simulation will provide a comprehensive analysis and an overall score to help you understand your marketing and sales performance and identify areas for improvement.
REAL MARKETING ANALYSIS AND SIMULATIONS
RISK MANAGEMENT ANALYSIS
Risk Management Simulation
The Risk Management Simulation helps you assess and optimize your company’s risk management strategies to protect against financial and operational risks. This simulation takes into account the following factors:
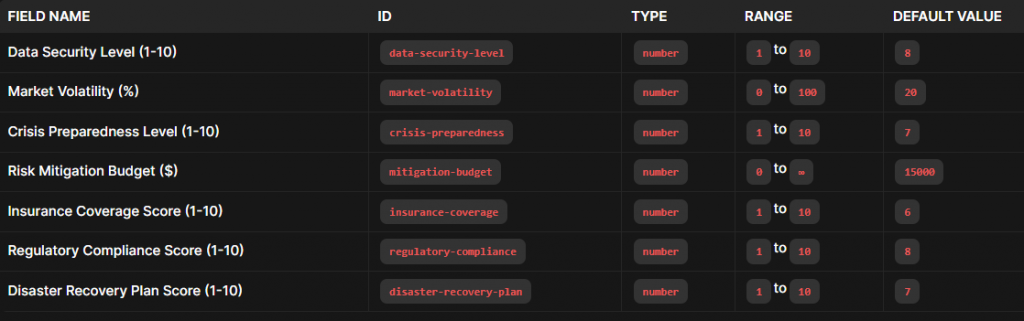
- Data Security Level (1-10) : Measures the effectiveness of your data security measures. Higher scores indicate better protection of sensitive information.
- Market Volatility (%) : Indicates the degree of fluctuation in the market, which can impact your business operations. Lower volatility suggests a more stable market environment.
- Crisis Preparedness Level (1-10) : Assesses your readiness to handle crises or unexpected events. Higher scores indicate better crisis management.
- Risk Mitigation Budget ($) : Represents the budget allocated for risk mitigation strategies. Adequate budgeting ensures effective risk management.
- Insurance Coverage Score (1-10) : Measures the level of insurance coverage to protect against financial losses. Higher scores indicate better insurance coverage.
- Regulatory Compliance Score (1-10) : Assesses adherence to relevant regulations and laws. Higher scores indicate better compliance.
- Disaster Recovery Plan Score (1-10) : Measures the effectiveness of your disaster recovery plan to restore operations after a disaster. Higher scores indicate a robust disaster recovery plan.
By inputting values for these fields, the simulation will provide a comprehensive analysis and an overall score to help you understand your risk management performance and identify areas for improvement.
SCALING AND GROWTH
Scaling and Growth Simulation
The Scaling and Growth Simulation helps you assess and optimize your company’s strategies for scaling and expanding operations. This simulation takes into account the following factors:
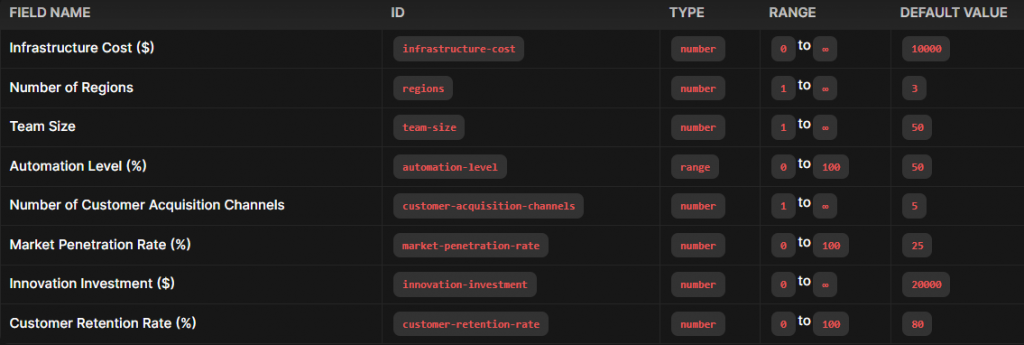
- Infrastructure Cost ($) : Represents the cost of scaling your infrastructure. Lower costs indicate more efficient infrastructure expansion.
- Number of Regions : Indicates the number of regions you plan to expand into. More regions can increase market reach and diversification.
- Team Size : Represents the current team size needed for scaling. Larger teams can support more extensive operations but require careful management.
- Automation Level (%) : Indicates the percentage of processes automated. Higher automation levels reduce manual effort and improve efficiency.
- Number of Customer Acquisition Channels : Represents the number of channels used to acquire customers. More channels can increase customer reach and acquisition.
- Market Penetration Rate (%) : Indicates the percentage of the market you have reached. Higher penetration rates suggest broader market coverage.
- Innovation Investment ($) : Represents the amount invested in innovation for growth. Higher investment in innovation can drive new products and services.
- Customer Retention Rate (%) : Indicates the percentage of customers retained over time. Higher retention rates are crucial for sustaining growth and reducing churn.
By inputting values for these fields, the simulation will provide a comprehensive analysis and an overall score to help you understand your scaling and growth strategies and identify areas for improvement.
TECHNOLOGY, INNOVATION, R&D ANALYSIS AND SIMULATIONS
Technology and Innovation Simulation
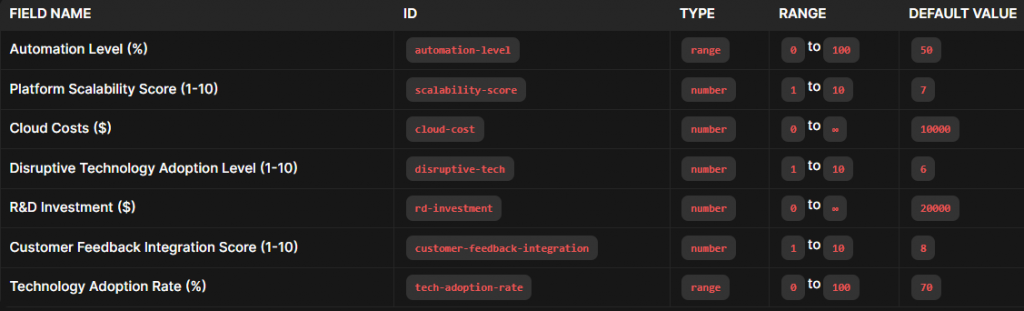
The Technology and Innovation Simulation helps you assess and optimize your company’s use of technology and innovation to drive growth and stay competitive. This simulation takes into account the following factors:
- Automation Level (%) : Indicates the percentage of processes automated. Higher automation levels reduce manual effort and improve efficiency.
- Platform Scalability Score (1-10) : Measures the scalability of your platform to accommodate growth. Higher scores indicate better scalability.
- Cloud Costs ($) : Represents the costs associated with cloud services. Lower cloud costs indicate more cost-efficient use of cloud infrastructure.
- Disruptive Technology Adoption Level (1-10) : Measures the adoption of disruptive technologies. Higher scores indicate more advanced and innovative technology use.
- R&D Investment ($) : Represents the amount invested in research and development. Higher investment in R&D can drive innovation and new product development.
- Customer Feedback Integration Score (1-10) : Measures how well customer feedback is integrated into your product development and decision-making processes. Higher scores indicate better integration.
- Technology Adoption Rate (%) : Indicates the percentage of customers adopting new technologies. Higher adoption rates suggest that your innovations are well-received and impactful.
By inputting values for these fields, the simulation will provide a comprehensive analysis and an overall score to help you understand your technology and innovation performance and identify areas for improvement.
SUSTAINABILITY ANALYSIS AND SATISFACTION SIMULATIONS
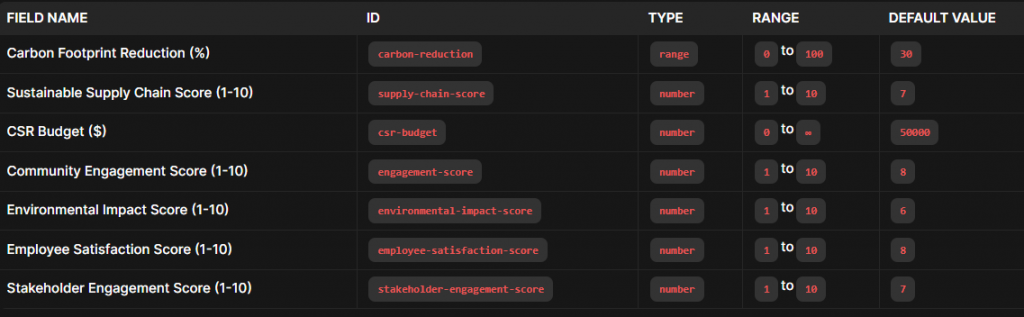
Sustainability and CSR Simulation
The Sustainability and CSR Simulation helps you assess and optimize your company’s sustainability and corporate social responsibility (CSR) initiatives to improve environmental impact and stakeholder engagement. This simulation takes into account the following factors:
- Carbon Footprint Reduction (%) : Indicates the percentage reduction in your company’s carbon emissions. Higher reduction rates contribute to environmental sustainability.
- Sustainable Supply Chain Score (1-10) : Measures the sustainability of your supply chain operations. Higher scores indicate more environmentally friendly supply chains.
- CSR Budget ($) : Represents the budget allocated for CSR initiatives. Adequate budgeting ensures effective sustainability and CSR efforts.
- Community Engagement Score (1-10) : Measures the level of engagement with local communities and stakeholders. Higher scores indicate better community relationships.
- Environmental Impact Score (1-10) : Represents the overall environmental impact of your company’s operations. Higher scores indicate more positive environmental practices.
- Employee Satisfaction Score (1-10) : Captures employee satisfaction levels with your sustainability and CSR initiatives. Higher scores indicate better employee engagement.
- Stakeholder Engagement Score (1-10) : Measures the level of engagement with various stakeholders, including investors, customers, and partners. Higher scores indicate better stakeholder relationships.
By inputting values for these fields, the simulation will provide a comprehensive analysis and an overall score to help you understand your sustainability and CSR performance and identify areas for improvement.
OPERATIONAL EFFICIENCY ANALYSIS AND SIMULATIONS
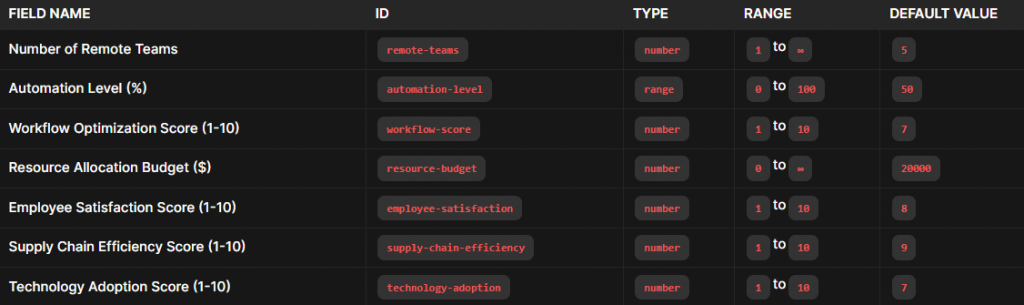
Operational Efficiency Simulation
The Operational Efficiency Simulation helps you assess and optimize your company’s operational processes to improve productivity and reduce costs. This simulation takes into account the following factors:
- Number of Remote Teams : Represents the number of remote teams managing operations. More remote teams can enhance flexibility and scalability.
- Automation Level (%) : Indicates the percentage of processes automated. Higher automation levels reduce manual effort and improve efficiency.
- Workflow Optimization Score (1-10) : Measures the efficiency of your workflows. Higher scores indicate more streamlined and productive workflows.
- Resource Allocation Budget ($) : Represents the budget allocated for resource allocation. Effective resource allocation ensures efficient use of funds.
- Employee Satisfaction Score (1-10) : Captures employee satisfaction levels. Higher scores indicate better employee morale and productivity.
- Supply Chain Efficiency Score (1-10) : Measures the efficiency of your supply chain operations. Higher scores indicate more effective supply chain management.
- Technology Adoption Score (1-10) : Represents the level of technology adoption in your operations. Higher scores indicate more advanced and efficient use of technology.
By inputting values for these fields, the simulation will provide a comprehensive analysis and an overall score to help you understand your operational efficiency and identify areas for improvement.
0 Comments